Top 15 Games like Visual Chart - Charting App|AppSimilar
What is the most difficult job for app operation and app store optimization?
The answer to this question is undoubtedly getting users. The app store is like a battlefield for acquiring users. Know yourself and your competitors, so as not to lose in this battle. So how to gain an advantage in the competition of the application store? Understanding competing products and doing ASO optimization are essential.
Now AppSimilar analyzes the app Visual Chart - Charting App and app like Visual Chart - Charting App from multiple aspects. In this report, you can see the performance of the app Visual Chart - Charting App & app like Visual Chart - Charting App, and get the information of fair app reviews, app ranking, top-grossing apps, etc.
1.Visual Chart - Charting App’s basic information

App Name:Visual Chart - Charting App
IAP:No
Category:Business
Download Last Month:<5K
Revenue:<5K
Average Rating:2.15
Number of Reviews:<5K
Facebook popularity:<5K
Versions:25
First Release Date:2016-03-24
This is the basic information about Visual Chart - Charting App provided by AppSimilar. Of course, the data that AppSimilar can provide is much more than that. So, how can AppSimilar help us?
- Through multi-dimensional analysis, understand the operation strategy of competing products, especially the set of keywords and user profiles.
- Help us get the traffic of competitors.
- Through the "Keyword Search" function, help us know the difficulty and volume of each keyword, and help us choose the appropriate keywords for ASO optimization.
- By comparing with competing products, we can clearly see our respective advantages and disadvantages, clarify our goals, and constantly optimize our operating strategies.
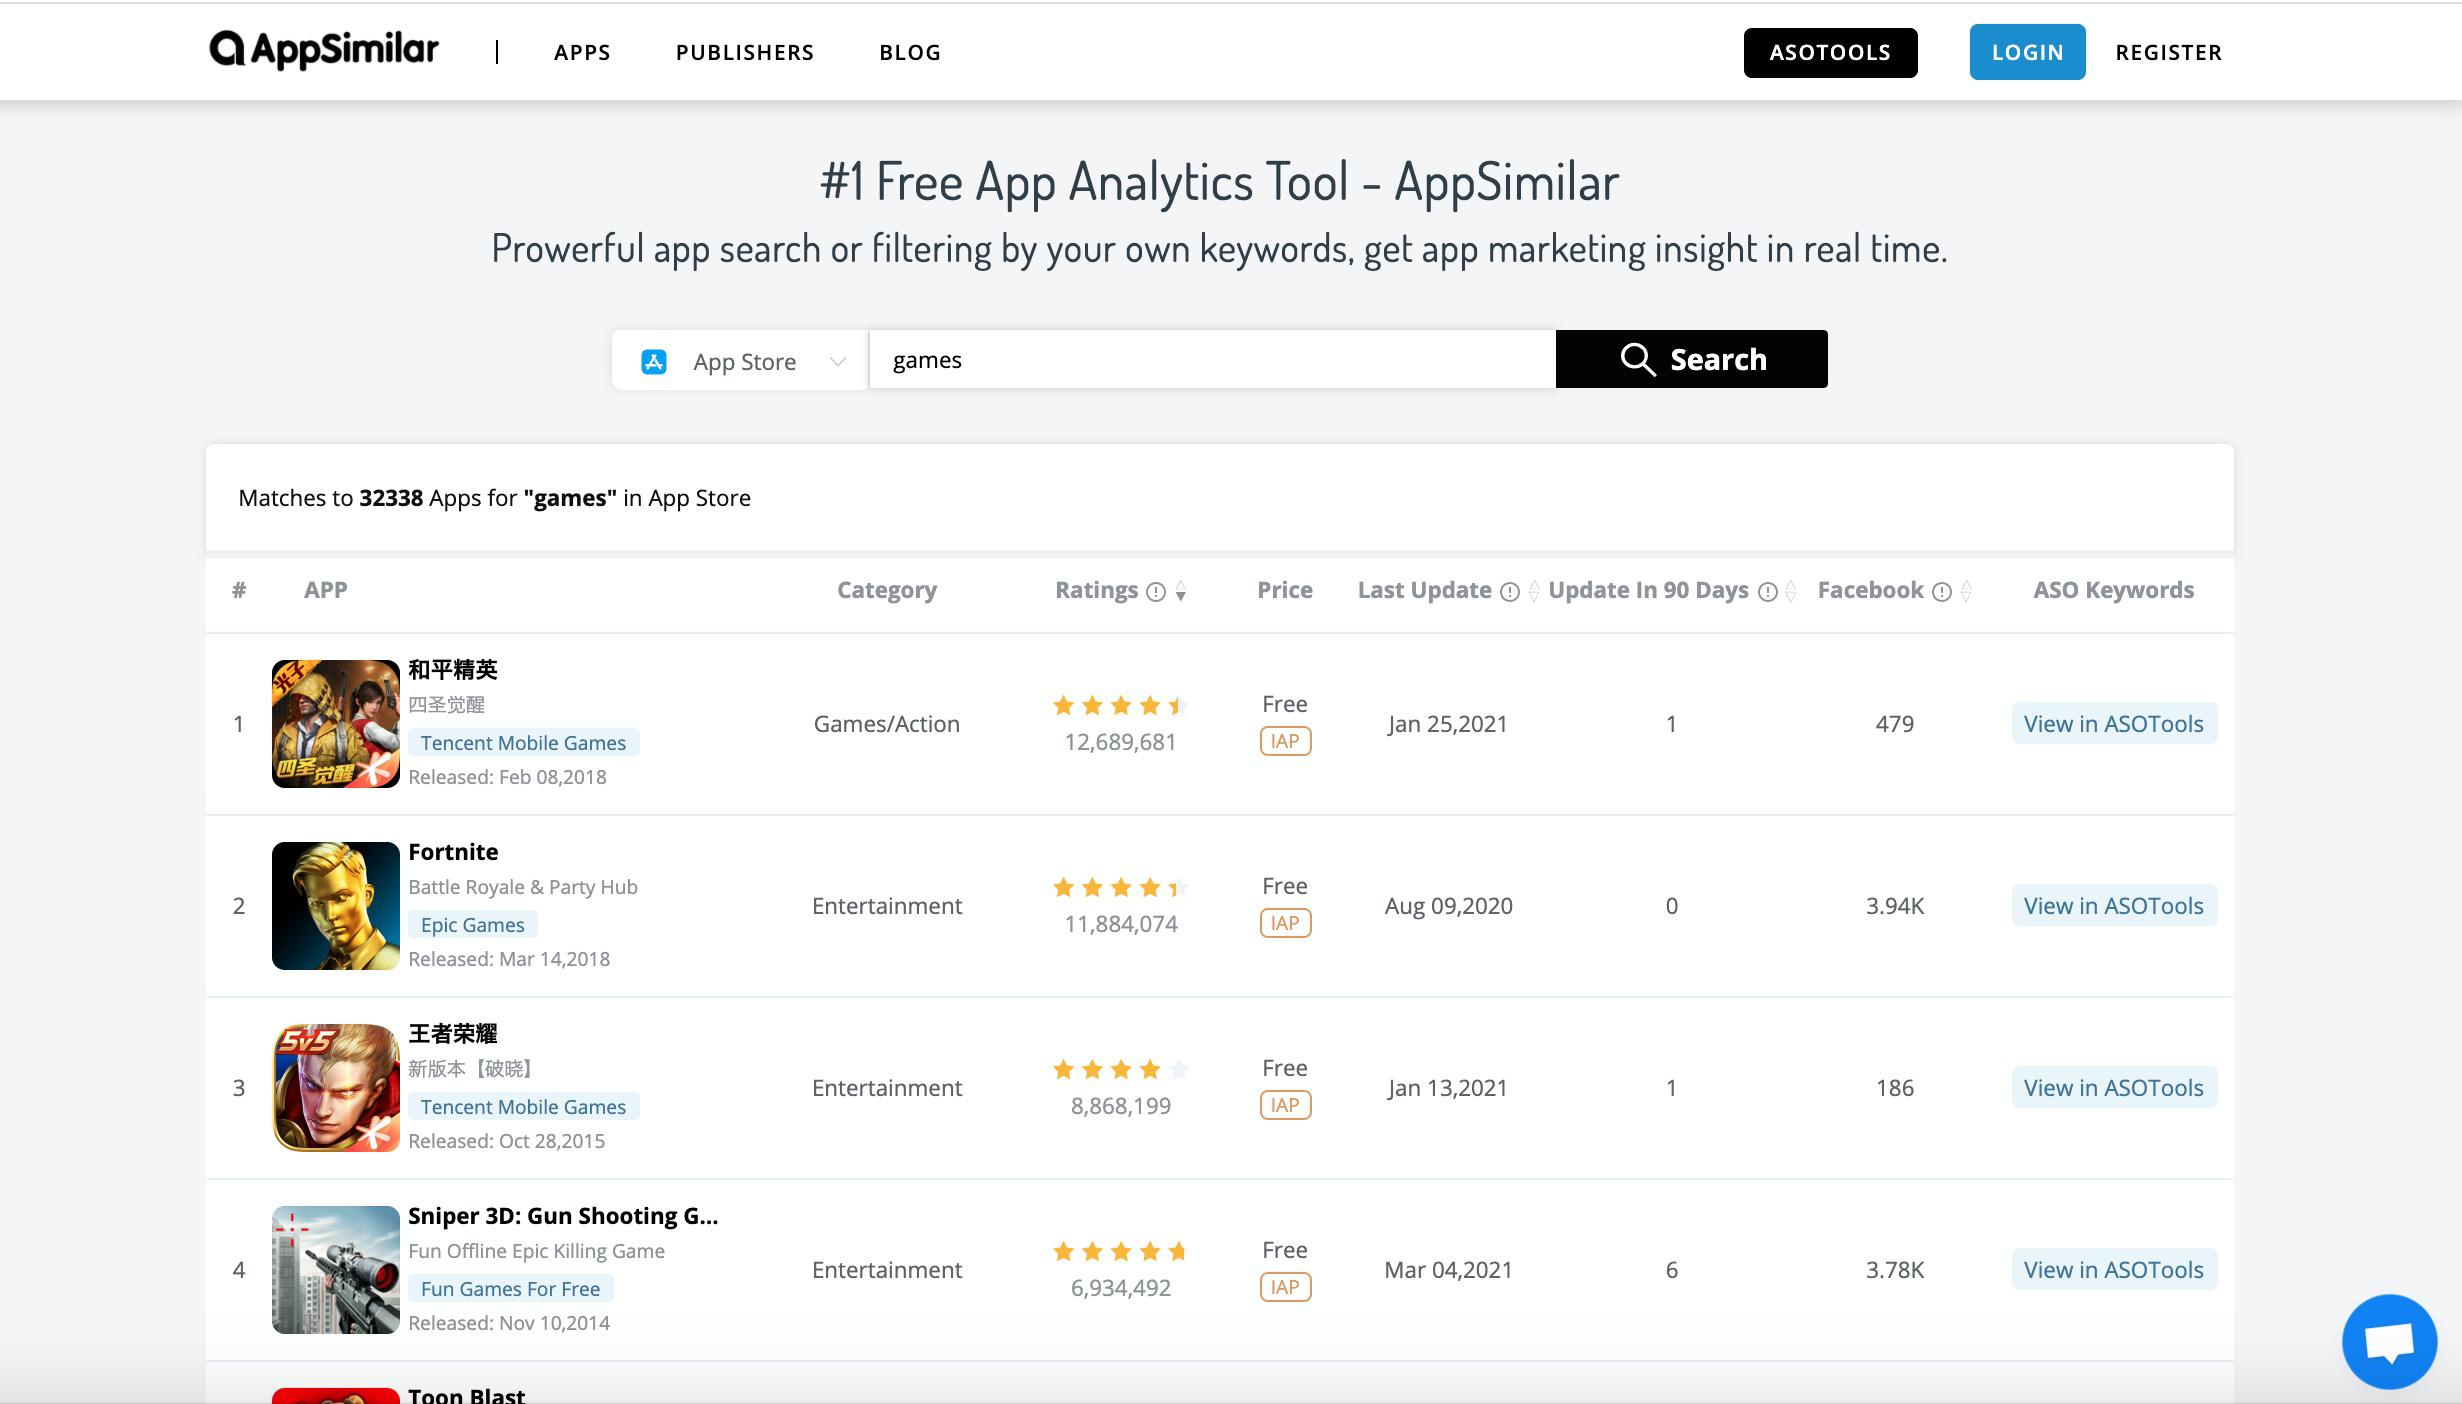
2. Mobile app analytics of app like Visual Chart - Charting App - AppSimilar
Visual Chart - Charting App has performed well in Business apps since 2016-03-24 went live. As can be seen from the data provided by AppSimilar, Visual Chart - Charting App had <5K downloads last month. It is worth mentioning that its popularity on Facebook has increased, and a total number of <5K people mentioned or followed it on Facebook.
The 15 apps listed below are all similar to Visual Chart - Charting App, they have similar functions, and may even have the same user crowd. Through AppSimilar's mobile app analytics function, we can clearly see the recent performance and detailed data of these apps like Visual Chart - Charting App. Obviously, these competing products can inspire us in many ways.
Without wasting time, let's start with the list!
A list of app like Visual Chart - Charting App
1. Microsoft Excel

Microsoft Excel's first release date is 2014-03-27. It's category is Productivity. There is a total number of <5K people mentioned or followed it on Facebook.
2. Microsoft Office
Microsoft Office's first release date is 2013-06-14. It's category is Productivity. There is a total number of <5K people mentioned or followed it on Facebook.
3. Brainstorm - Creative Idea Generator
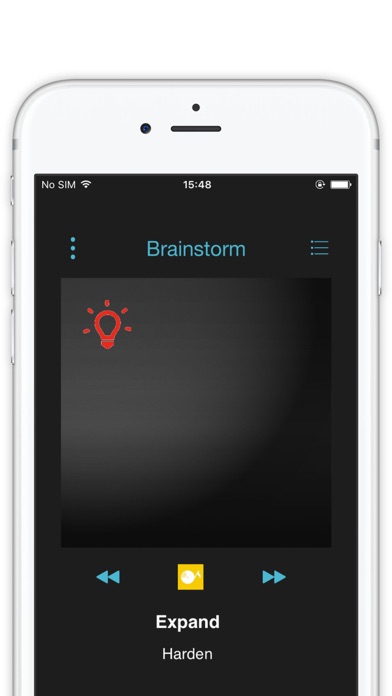
Brainstorm - Creative Idea Generator's first release date is 2016-07-07. It's category is Productivity. There is a total number of <5K people mentioned or followed it on Facebook.
4. Simple Calendar - Calendar app

Simple Calendar - Calendar app's first release date is 2018-11-16. It's category is Productivity. There is a total number of <5K people mentioned or followed it on Facebook.
5. Sushi Bar Idle

Sushi Bar Idle's first release date is 2018-10-12. It's category is Games. There is a total number of <5K people mentioned or followed it on Facebook.
6. 石墨文档

石墨文档's first release date is 2015-09-03. It's category is Productivity. There is a total number of <5K people mentioned or followed it on Facebook.
7. Chordify - chords for any song

Chordify - chords for any song's first release date is 2016-09-11. It's category is Music. There is a total number of <5K people mentioned or followed it on Facebook.
8. Google Sheets

Google Sheets's first release date is 2014-04-30. It's category is Productivity. There is a total number of <5K people mentioned or followed it on Facebook.
9. Business Card Reader

Business Card Reader's first release date is 2014-09-23. It's category is Business. There is a total number of <5K people mentioned or followed it on Facebook.
10. Live Voice Changer - Prankcall

Live Voice Changer - Prankcall's first release date is 2018-02-08. It's category is Entertainment. There is a total number of <5K people mentioned or followed it on Facebook.
11. 易采通-政府采购招标投标必备工具

易采通-政府采购招标投标必备工具's first release date is 2017-01-02. It's category is 商务. There is a total number of <5K people mentioned or followed it on Facebook.
12. 云听

云听's first release date is 2012-01-25. It's category is 娱乐. There is a total number of <5K people mentioned or followed it on Facebook.
13. 办公软件学习教程

办公软件学习教程's first release date is 2020-01-09. It's category is Business. There is a total number of <5K people mentioned or followed it on Facebook.
14. Docu Scan - Document Scanner, PDF Converter and Receipt Organizer

Docu Scan - Document Scanner, PDF Converter and Receipt Organizer's first release date is 2015-04-24. It's category is Business. There is a total number of <5K people mentioned or followed it on Facebook.
15. Barchart Stocks & Futures

Barchart Stocks & Futures's first release date is 2013-11-18. It's category is Finance. There is a total number of <5K people mentioned or followed it on Facebook.
These are the 15 most popular apps similar to Visual Chart - Charting App. So which of these apps have the most downloads, which apps have the most revenue? Let's take a look at the ranking of these apps like Visual Chart - Charting App.
App ranking by Download
Top 3 download apps in last month
| 1st | 2nd | 3rd | |
| App Name | Microsoft Excel | Microsoft Office | Brainstorm - Creative Idea Generator |
| Download Last Month | <5K | <5K | <5K |
| Average Rating | 4.65 | 4.6 | 0.1 |
| Number of Reviews | 2.05M | 49.6K | <5K |
| Revenue | <5K | <5K | <5K |
Top grossing apps
Top 3 grossing apps in last month
estimate apps revenue from in-app purchases and price of apps in last month.
| 1st | 2nd | 3rd | |
| App Name | Microsoft Excel | Microsoft Office | Brainstorm - Creative Idea Generator |
| Revenue | <5K | <5K | <5K |
| Download Last Month | <5K | <5K | <5K |
| Average Rating | 4.65 | 4.6 | 0.1 |
| Number of Reviews | 2.05M | 49.6K | <5K |
The above is the comprehensive rank of apps like Visual Chart - Charting App. If you want to know more detailed information, you can search on AppSimilar (appsimilar.com). After collecting an app on the platform, you can see detailed information like this:
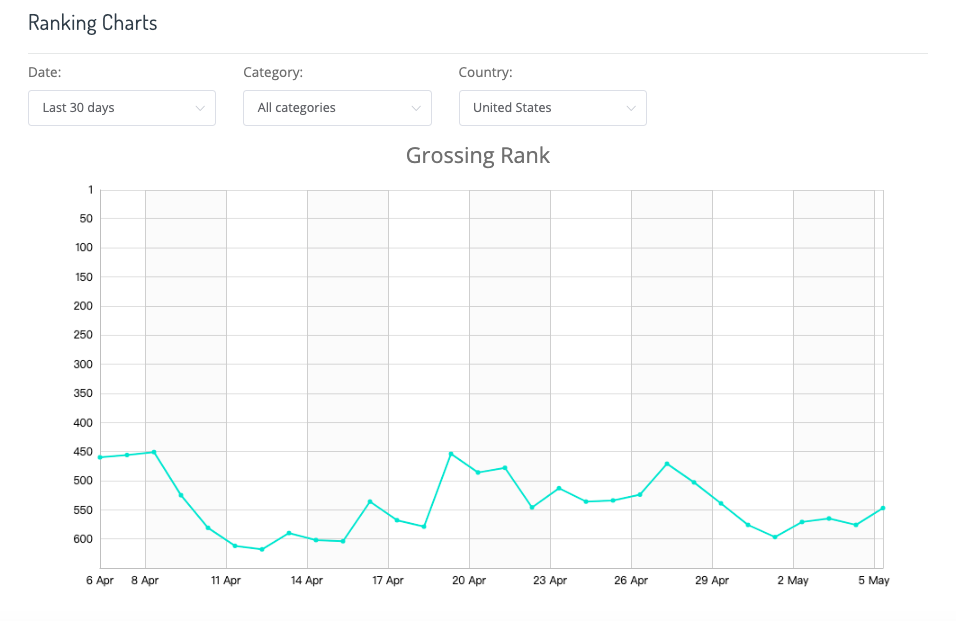
3. Fair app reviews of Visual Chart - Charting App
How to evaluate an app is actually a very subjective thing, some people like it, some people don't. For our publisher, how to find fair reviews of our own apps and competing apps? This is a matter that can be solved by data. Through the data of AppSimilar, we can fully understand the user's reaction to the app.
Visual Chart - Charting App has a total number of <5K reviews in the app store or google play. And the average rating of all regions is 2.15.
Among all the apps like Visual Chart - Charting App, the highest download in last month is Microsoft Excel, the highest-grossing app is Microsoft Excel.
We can compare Visual Chart - Charting App with the top3 apps in apps like Visual Chart - Charting App. App with a high average rating indicates that it is liked by users; Facebook's popularity means that the app is popular on social media. The higher revenue app also means it will have a more benign cycle.
In different stages, the core indicators of the apps are different. In the initial stage of app operation, acquiring users is the core goal, downloads is the core data indicators we should pay attention to. When the product is more mature, and already has a considerable number of users, then how to monetize is the issue we should consider, and accordingly, the revenue has become the core data indicator of our concern.
4.App store keywords research report about "Visual Chart - Charting App"
As you know, Keyword Search is a must for application store optimization. Therefore, we will do a case study on "Visual Chart - Charting App" to facilitate you to choose the best keyword as the optimization goal.
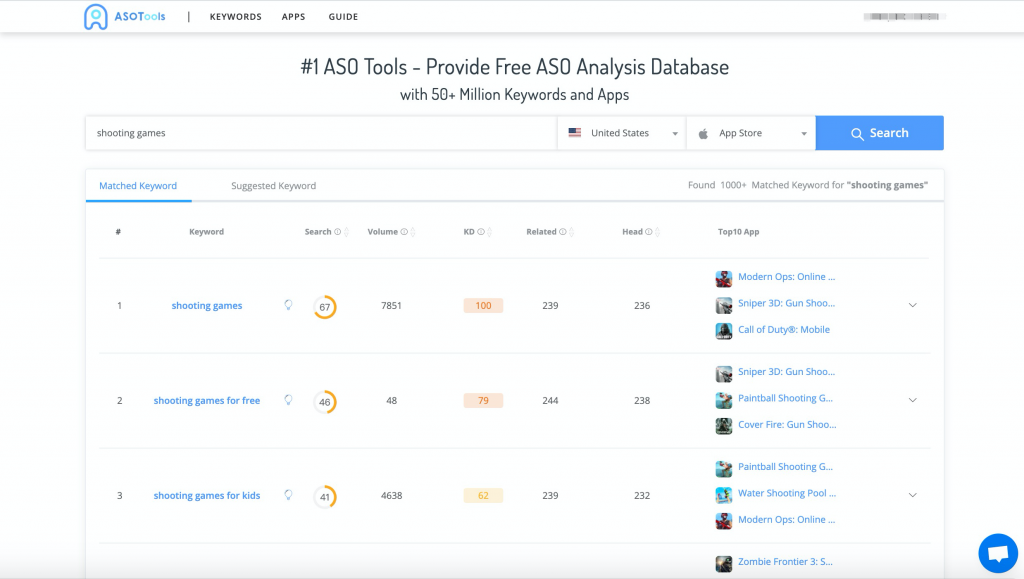
More keywords research case similar to Visual Chart - Charting App :
(6)"石墨文档 "App Store Keywords Research Case Analytic | ASOTools
Conclusion: The above is a free tracking analytics report about app like Visual Chart - Charting App. In the process of ASO optimization, we must constantly study and research, understand the latest information about competitive products and industry, and constantly optimize our own operation strategy. Through the use of tools, such as AppSimilar, we can grasp all data faster and more accurately, providing a basis for us to set an ASO optimization strategy. I hope that this analysis report will allow you to gain more.
