A Worth Expectable Mobile App Analytics Platform: AppSimilar

What is AppSimilar? It’s a free mobile app analytics platform.
When it comes to mobile app data analytics, we always have questions. With so many mobile app data analysis tools, what’s the difference between them? Which is better, and which one should be used as a developer(or an investor or an advertiser)?
While this is a cliche, it’s important, and we’re always trying to find the answer to this ultimate question.
If you Google search for information about this area, it’s hard to find a fair idea. Because evaluators of a particular data analysis tool may come from different perspectives and have some personal feelings.
Mobile apps are no longer a single, simple tool today. As our mobile apps become more complex, we need to use analytics tools to track and analyze every part of the Application scenario.
Fortunately, there are many data analysis tools available for App development teams to choose from.
In fact, these new generations of data analytics tools have been able to monitor every small event that occurs in the app, such as tracking user visits, knowing which platform they’re downloading apps from, seeing their jump paths in the app, and recognizing those pages most popular in the app.

Most mobile app analytics tools on the market develop their own products for specific groups, scenarios, functional needs, verticals, including:
1). User segmentation(eg. Upsight(including paid items), Tap stream(free), Flurry Analytics(free) and Captain(including paid items)),
2)User behavior analysis(eg. MixPanel(paid), AMPLitude(paid) and Heap(paid)),
2). Touch-screen hotspot analysis(eg. HeatMa.ps heat map(paid) and Heat Data(paid)),
3). In-app buying behavior tracking(eg. Appsflyer(including paid items) and Appfigures(including paid items)),
4). Channel tracking & in-app advertising management(eg. Apsalar(including paid items) and AppAnnie(including paid items)),
5). Basic data statistics(eg. Amazon Mobile Analytics(free) and Roambi(payable)),
6). Focus on the hand-travel analysis(eg. Honey tracks(including paid items) and Playtomatic(free)), etc.
At this stage, AppSimilar provides data to users: downloads, revenue, DAU, app rankings, comments, Facebook replies/likes/retweets, number of published versions, and latest releases across industries in different countries. In the long run, the thing AppSimilar needs to do is integrate an app from the most basic to the most critical metrics and present it to developers/investors/advertisers.
How to use AppSimilar?
AppSimilar, which is free and data-rich, has a total of 300w of app analysis data.
AppSimilar users can not only view app download estimates for different time periods, but also app revenue, a number of active users, and ratings. Our estimates include downloads from the App Store and Google Play in the United States from October 1, 2018, to October 31, 2019. Excludes Apple apps and Google pre-installed apps. We report only unique installations. Android is estimated not to include third-party stores. Numbers represent the total installs for all application versions, such as Facebook and Facebook Lite.
What can AppSimilar do as a mobile app analytics tool?
For example, if you want to see the app with the highest revenue in a certain region or category, you can get the answer you want directly by screening. Do you think its interaction is very simple, which is one of its greatest advantages?
If you check on AppSimilar, you’ll find that apps with high revenue are all IAP. At the same time, in-app advertising is also a very common way of making app profits.
When I did competitive product analysis before, I estimated their operation through DAU, Download, Revenue, and Reviews. It always brings me some surprises.
Use AppSimilar to analysis the market. For example, you can see TikTok’s download data on AppSimilar, it is a very impressive 43M. For an app with such an order of magnitude, the CPI advertising fee will be higher and higher, which is certain, all advertising platforms are the same. If anyone thinks advertising doesn’t work well, it’s because you’re not leveraging that audience. TikTok has a billion users in more than 60 countries. But if you take advantage of TikTok, you’ll be pleasantly surprised by the results.
Most people care more about downloads of the app. Downloads are certainly a useful metric. If you are working on app monetization, three metrics that you mustn’t get away also: downloads, DAU, revenue and ARPU.
The income will be different depending on a different country, iOS or Android, and what type of app you use.
For example, the same 100, 000 downloads, the best one made $43 million, and the worst one only made $5, 000. This means that for 100,000 downloads, you can get as little as $5k. If you do well, you can get as much as $43M.
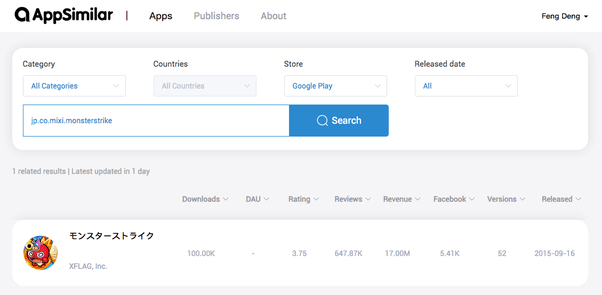
This app below get 17M revenue in OCT. If your app is for Google Play and your app is also for Japanese, congratulations, you have a higher chance of making more money than developers in other regions and devices.
This app below makes a lot less money than other apps. Why?
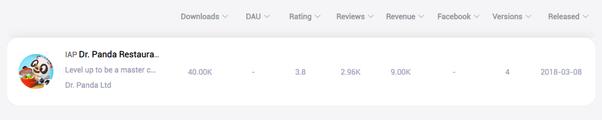
1). Too few updates. Since March 2018, there have been 4 versions of this app on the shelves, without any quick adjustments according to players’ preferences.
2). Didn’t make good use of the social platform. There is no interactive data on facebook, which means that this app has not been promoted on Facebook, the largest social platform.
Compared to those mature paid tools or platforms, AppSimilar has a lot to do. While it is not possible to challenge them in a short period of time, It is believed that Over time, We believe AppSimilar will become the most indispensable mobile app analytics platform for users to work on a daily basis.